
| Main Page |
|
Capacitance |
|
Polarization | Cursos |
|
Neil C. Bruce | |||||
|
Time-of-flight optical
tomography for medical applications
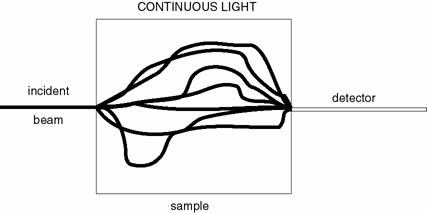
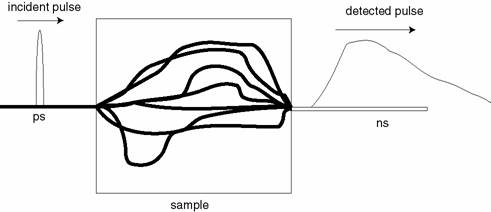
Currently there is a great deal of interest in the problem of scattering of light in dense volumes, because of the possible application in medicine, particularly in the detection of breast cancer . This technique involves the illumination of the sample with a laser and the detection of the light at another point on the sample surface. The incident light can be continuous (as in a conventional laser) o pulsed (which requires specialized lasers to be produced. However, it has been shown that, due to the effect of light scattering inside samples similar to tissue, continuous light does not allow the detection of small objects inside the samples. Using a pulsed laser means that the emerging light is also in the form of a pulse but it is longer in time than the incident pulse. In this case the light which is detected first (which passed the least time inside the sample) is the light which has traveled in the straightest line between the source and the detector. Using this technique the resolution of the method can be improved greatly (smaller objects can be detected). This is illustrated in the figure below.
 |
 |
Using the laser pulse technique the detection resolution for objects in tissue with numerical methods (Monte Carlo) or approximate methods (diffusion approximation or random walk) as well as experimental measurements, in the literature, it has been reported that it is possible to detect an absorbing inclusion inside the human breast if it is bigger than 5mm in size . These results are important because, when breast cancer starts, there is a vascularization process which increases the flow of blood to the affected area to help the growth of the cancer. For these tests a wavelength of 800nm is used because this value represents a minimum in the absorption of the blood, but, even with this limitation, the increase of absorption due to the vascularization in the breast is detectable with the light pulse technique. However, the resolution possible with X-rays for this same problem is less than 1mm, which represents a challenge for optical tomography.
To obtain a resolution of 5mm the light pulse technique
was used. The output pulse (which lasts a few nanoseconds) was detected.
Because of the very low light level coming out of this type of sample
(such as tissue) for breast-like sample sizes, the detected pulse is
very noisy and is impossible to analyze directly. To calculate the
signal from the first part of the pulse, i.e. detect only the light
which has traveled closest to the straight-through direction between the
source and the detector, the detected pulse was fitted to the diffusion
theory result. Then the theoretical diffusion theory result was used to
detect only the light in the first part of the pulse (this pulse has no
noise) to construct the image.
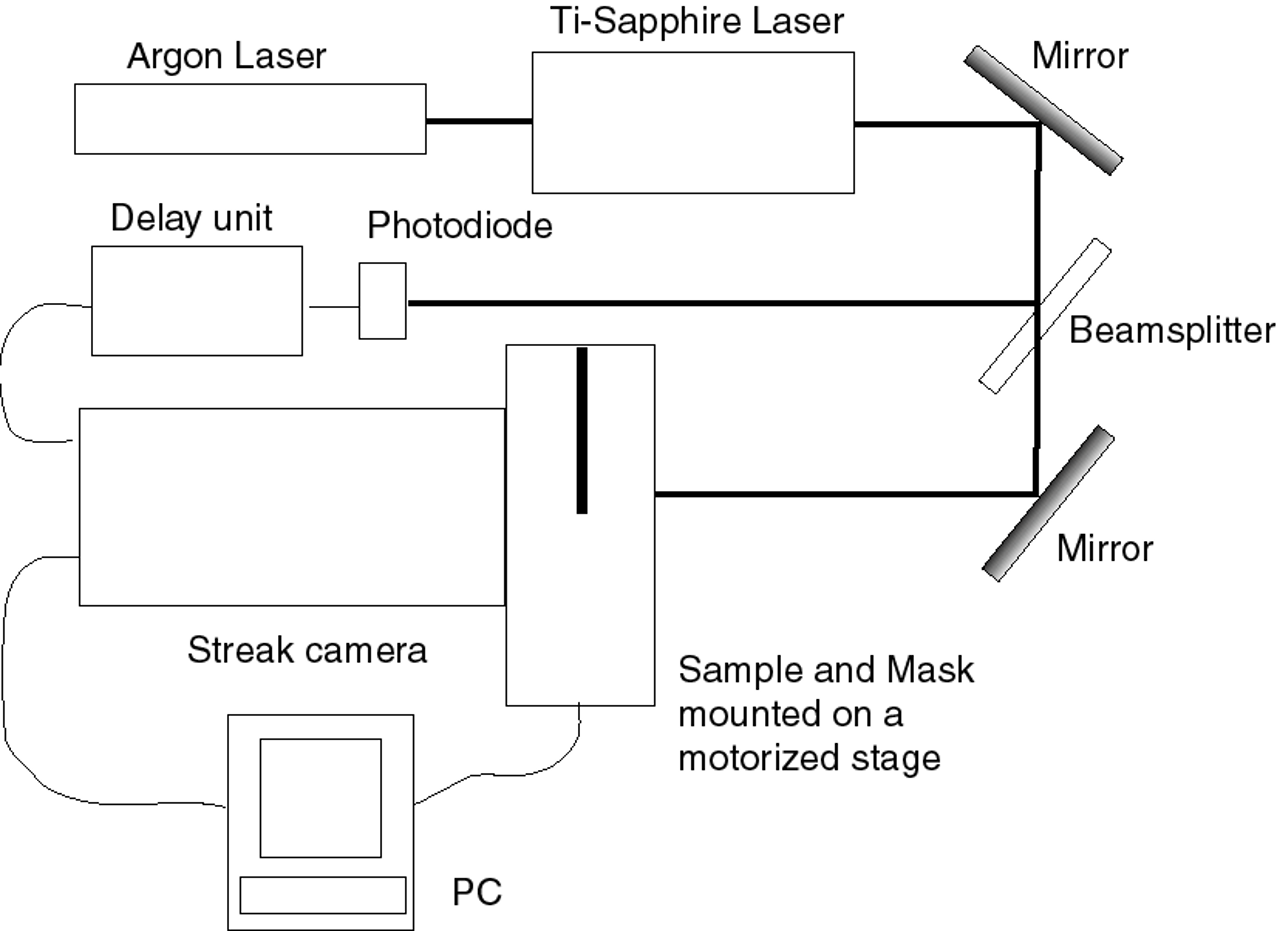
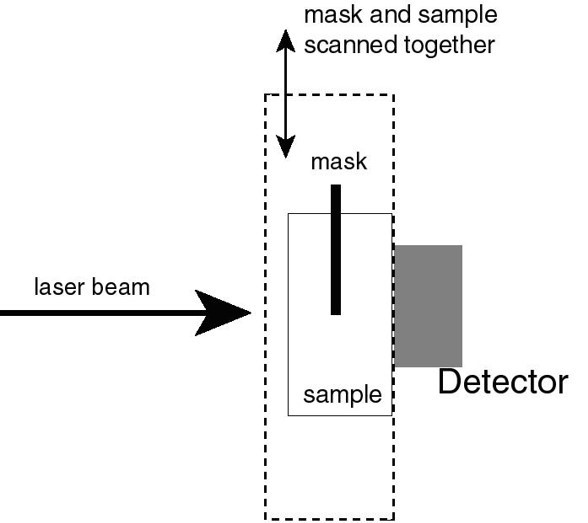
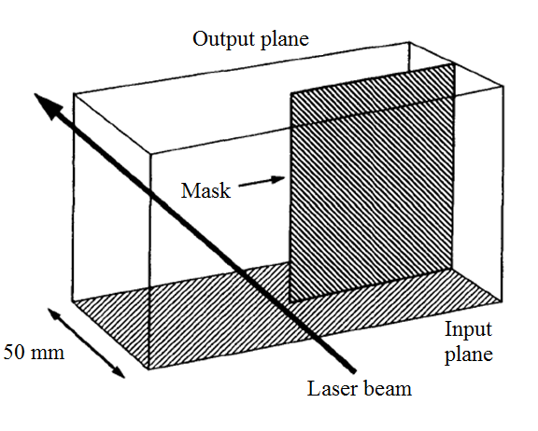
The following figure shows the experimental setup (on the
left) we used to detect the transmitted pulses using a sample of whole
milk. The figures on the right show the setup and the scan performed on
the sample to measure the image of an edge, which allows us to calculate
the resolution.
 |
  |
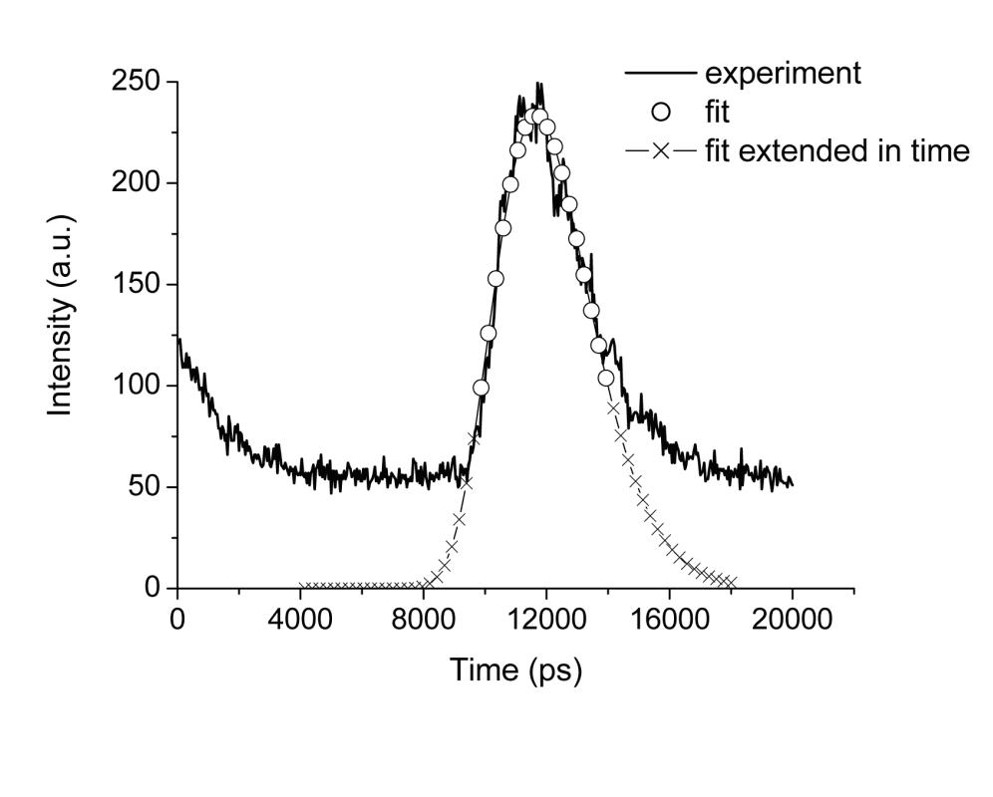
The detected pulses as the edge is moved across the direct beam can be analyzed by fitting the diffusion approximation or the cumulant expansion methods, and then selecting only the part of the pulse of interest. In particular we analyzed the variation of the resolution obtained by varying the integration time of the detected pulse, see the figure below.
 |
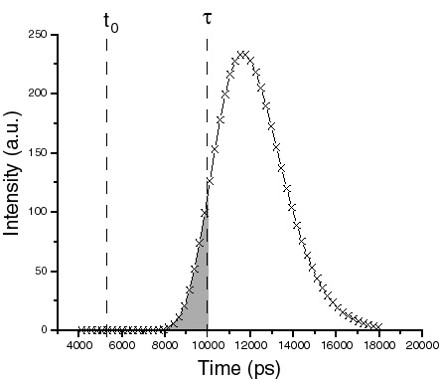 |
Here, the graph on the left shows an experimental pulse as a dark line. The theoretical expression (diffusion or cumulants) is fitted to this pulse, shown as the circles. This pulse is then theoretically extended to shorter and longer times, giving the line with crosses which is also shown on the graph on the right. This curve represents what we would theoretically expect for a perfect detector (noise-free and without a dark signal). This means that we can extract the very-early-time signal from this pulse (up to time tau in the graph on the right above) , which we expect to be the light that travels most nearly directly through the sample, so should have a type of shadow image of the object which is inside the scattering liquid.
Calculating the images and the resolution, using different values of the integration time tau, gives the results shown in the following graphs.
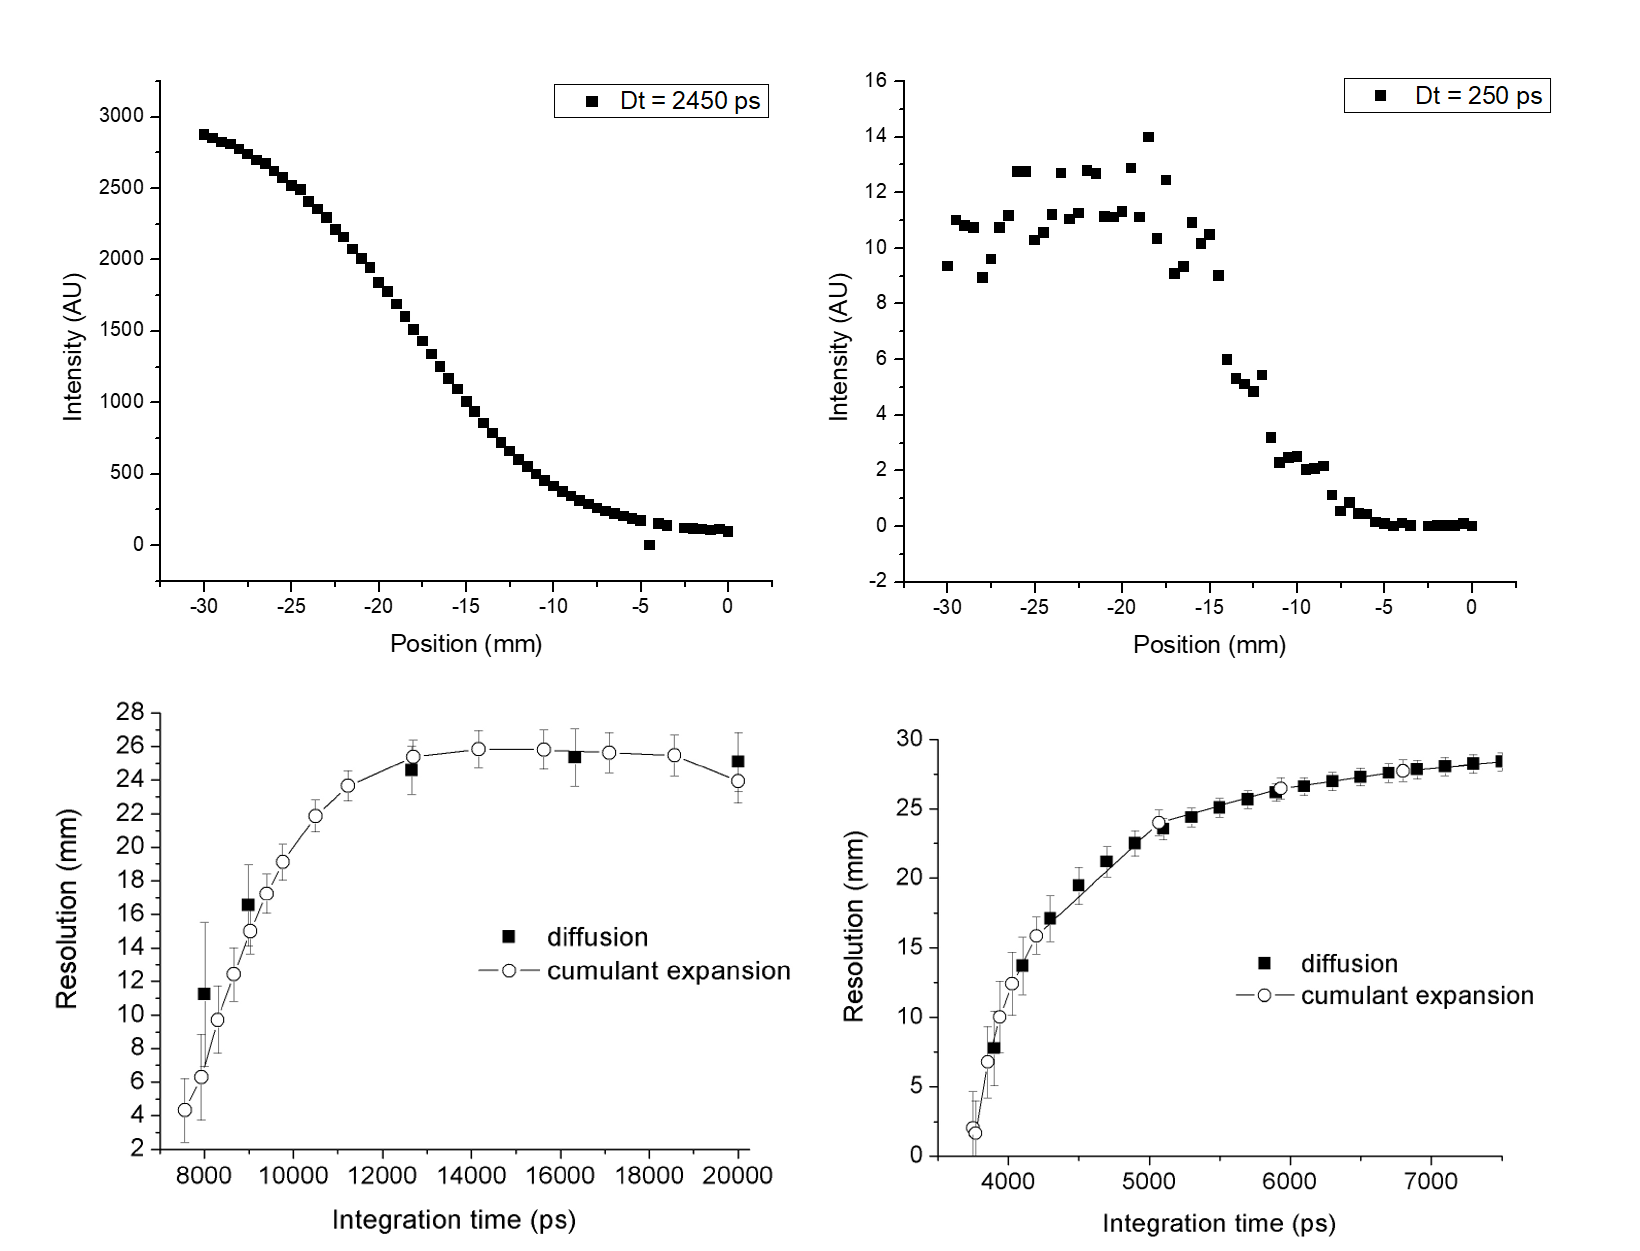
The graphs at the top of this figure represent the edge response functions (ERF) obtained for a mask embedded in the tissue mimicking phantom using the diffusion approximation for an integration time of 2450 ps on the left, and for an integration time of 250 ps on the right. It can be seen from these curves that for long integration times, the image of the edge has a very low slope, which is indicative of poor resolution. The curve on the right, on the other hand, is much noisier (it covers a much smaller part of the transmitted pulse), but it has a steeper slope at the edge, indicative of a better resolution.
The bottom graphs show the resolution for different theories. On the left the graph is for whole milk in a 50 mm wide phantom, and on the right for diluted milk (33% milk, 67% water) in a 50 mm width phantom (this second case has optical properties similar to tissue. From these graphs it can be seen that the resolution improves as the integration time is reduced, as expected, and that fitting with the cumulant expansion method gives results with resolution better by a factor of about 3. It should also be noted that beyond the limits shown in these graphs the ERFs are too noisy to obtain any useful information.
PUBLICATIONS
1. E. Ortiz-Rascón, N.C. Bruce, A. Rodríguez-Rosales, R. Ortega-Martínez y J. Garduño-Mejía, "Improved spatial resolution in time-resolved transillumination imaging using temporal extrapolation with the cumulant expansion solution to the transport equation", Revista Mexicana de Física, 60, (2014), pp. 1-7.
E. Ortiz-Rascón, N.C. Bruce, A.A. Rodríguez-Rosales and J. Garduño Mejía, "Time of flight dependent linearity in diffuse imaging: How effective is it to evaluate the spatial resolution by measuring the ESF?", Applied Optics, 55(7), (2016), 1613-1617
| ICAT |